How to “See” Songs
Anyone that teaches birdsong will probably tell you that watching a bird while it is singing is the best way to learn their song. It allows you to use two senses, sight and sound, and that helps you retain the memory better than just listening to the song and trying to remember the bird’s name that goes with it.
But, someone, at some point in time, decided that it was a good idea to put leaves on trees and have grasses grow taller than the birds. So, in many, if not most situations, you can’t see the bird while it’s singing.
So, is there a way to “see” the songs without seeing the bird? Yes! It’s called a spectrogram.
What is a Spectrogram?
Some call them sonograms, but in our minds, a sonogram is a picture of your baby before it’s born. We much prefer the term spectrogram. A spectrogram is simply a visual representation of the sounds made by a bird. It’s similar to reading music.
Musicians can look at the notes of a song and formulate the sound of that song in their heads. With the use of spectrograms, you can do the same thing with birdsongs.

Don’t let the term “spectrogram” scare you. While it may look terribly technical, it’s really not.
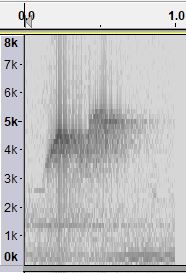
The scale across the top is time. You can see in this spectrogram that a single song from an Eastern Phoebe is less than one-second long.
The scale on the left is the frequency or pitch of the song. Low-frequency sounds are found near the bottom, while high-frequency sounds are found nearer the top of the scale. In the case of the phoebe song in the spectrogram above, you can easily see that the first syllable of the song (fee) is a little lowered in pitch than the second syllable of the song (bee). Pretty easy stuff, right?
The only thing we might add to this spectrogram is more songs. That will tell us how often the bird sings, its song intensity. That is simply a matter of adding more time to the recording (and thus, the spectrogram).
How Can You “See” Birdsong?
How can you “see” the song of any bird? Or, for that matter, any sound?
Ok, you caught us; we lied. We need to add a couple more things. First is movement.
In order to add movement to a spectrogram, you’ll need a recording of the bird’s song. We supply you with plenty of them throughout all of our free and premium courses. On top of that, we’ll guide you to several other places where you can get even more recordings. We’ll even teach you how to create your own recordings in one of our courses.
The next thing you need is the ability to listen to the song. All computers have built-in speakers, but we don’t think much of the sound quality you get from those. We prefer to use headphones.
Can I use earbuds? Yes, but we don’t like them much. They may be more comfortable than headphones, but we’re after sound quality first, comfort second.
Almost any kind of headphones will work. We happen to use two kinds. One is a Sony MDR-ZX100. These are known as on-ear headphones because they, well, sit on your ears. On-ear headphones allow you to hear other things happening around you while having the headphones on.
The other ones we use are over-ear JBL brand headphones. Over-ear headphones sit around your entire ear and block out most of the ambient sound around you.
The last thing you need is software on your computer that can display spectrograms from recordings. The display screen must show a continuous vertical line referencing the exact place in the song a particular sound is coming from. We do that using specialized software.
This specialized software has to meet four criteria:
- It must enable you to create spectrograms from sound files on your own computer.
- It must be compatible with either Windows or Mac computers.
- It must be ridiculously easy to use. And …
- It must be FREE!
Fortunately, there are a few such software packages out there to choose from. At Birdsong 101, we use Audacity and highly recommend that you use it as well. (Birdsong 101 does not have any affiliation with Audacity or anyone associated with it.)
Audacity
All of the spectrograms you’ll see in our courses were created using Audacity software. As we mentioned above, it’s very easy to use. And, did we mention that it’s FREE!
After downloading the software and doing just a little bit of setup work, you will create spectrograms just like the ones in our courses by simply starting the software and opening a sound file. It really is just that EASY!
Go to https://audacityteam.org, choose the version for your computer, and click on “Download.” Once the program is downloaded, open the file. From there, simply follow your computer’s instructions to install and run the program.
Once you have Audacity downloaded, there are a few simple steps you’ll need to take to set it up to view spectrograms. Click on the button below to get it all ready to go.
